Granules#
[1]:
import starepandas
import geopandas
import pystare
import matplotlib.pyplot as plt
import importlib
import copy
[2]:
fname = '../tests/data/granules/MOD05_L2.A2019336.0000.061.2019336211522.hdf'
modis = starepandas.read_granule(fname, latlon=True, sidecar=True, xy=True)
[3]:
modis = copy.copy(modis[(modis.y>250) & (modis.x<150)])
[4]:
modis
[4]:
| lat | lon | sids | x | y | Scan_Start_Time | Solar_Zenith | Solar_Azimuth | Sensor_Zenith | Sensor_Azimuth | Water_Vapor_Infrared | |
|---|---|---|---|---|---|---|---|---|---|---|---|
| 67770 | 64.289093 | -16.075922 | 3662037656027565065 | 0 | 251 | 8.493986e+08 | 136.769997 | -17.160000 | 65.359999 | -87.399998 | NaN |
| 67771 | 64.298607 | -16.575207 | 3662124605389551017 | 1 | 251 | 8.493986e+08 | 136.689997 | -17.820000 | 64.739999 | -87.849998 | NaN |
| 67772 | 64.305969 | -17.040155 | 3662126430541234153 | 2 | 251 | 8.493986e+08 | 136.619997 | -18.440000 | 64.129999 | -88.269998 | NaN |
| 67773 | 64.311798 | -17.501287 | 3662105186047635465 | 3 | 251 | 8.493986e+08 | 136.549997 | -19.060000 | 63.529999 | -88.689998 | NaN |
| 67774 | 64.315926 | -17.928263 | 3732481344770526057 | 4 | 251 | 8.493986e+08 | 136.489997 | -19.620000 | 62.929999 | -89.079998 | NaN |
| ... | ... | ... | ... | ... | ... | ... | ... | ... | ... | ... | ... |
| 109495 | 69.114990 | -47.227417 | 3744993157413528587 | 145 | 405 | 8.493987e+08 | 126.089997 | -51.889999 | 4.470000 | 69.109998 | NaN |
| 109496 | 69.095970 | -47.343407 | 3744993282781123915 | 146 | 405 | 8.493987e+08 | 126.069997 | -52.029999 | 4.920000 | 68.649998 | NaN |
| 109497 | 69.076836 | -47.459351 | 3744993705556370667 | 147 | 405 | 8.493987e+08 | 126.049997 | -52.169999 | 5.370000 | 68.239998 | NaN |
| 109498 | 69.057602 | -47.575237 | 3744992437391885067 | 148 | 405 | 8.493987e+08 | 126.019997 | -52.309999 | 5.820000 | 67.879998 | NaN |
| 109499 | 69.038269 | -47.691101 | 3745022036721761931 | 149 | 405 | 8.493987e+08 | 125.999997 | -52.439999 | 6.270000 | 67.559998 | NaN |
23250 rows × 11 columns
[5]:
trixels = modis.make_trixels()
modis.set_trixels(trixels, inplace=True)
[6]:
geom = geopandas.points_from_xy(modis.lon, modis.lat)
modis.set_geometry(geom, inplace=True)
[7]:
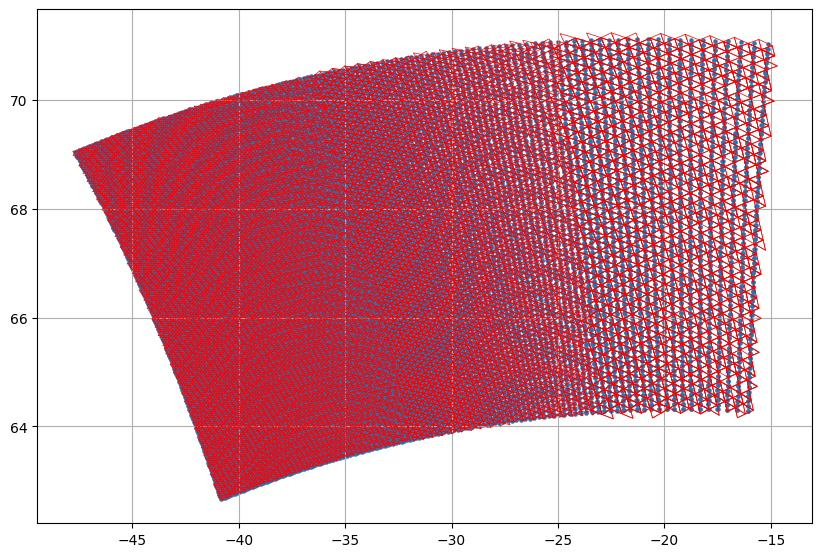
fig, ax = plt.subplots(figsize=(10, 10), dpi=100)
ax.grid(True)

modis.plot(trixels=False, ax=ax, marker='.', markersize=20)
modis.plot(trixels=True, color='r', ax=ax, lw=0.5)

#plt.savefig('modis.png')
[7]:
<AxesSubplot:>
Plotting footprints#
[8]:
fname = '../tests/data/granules/MOD05_L2.A2019336.0000.061.2019336211522.hdf'
mod05 = starepandas.io.granules.Mod05(fname)
[9]:
mod05.read_sidecar_cover()
mod05.stare_cover
[9]:
masked_array(data=[3614138700964823044, 3616390500778508292,
                   3618642300592193540, ..., 4298608878511194121,
                   4298613276557705225, 4298668252139094025],
             mask=False,
       fill_value=999999)
Manually getting the 2D STARE array#
[10]:
import netCDF4
from pyhdf.SD import SD
import numpy
import pystare
import datetime
[11]:
hdf = SD(fname)
lon = hdf.select('Longitude').get().astype(numpy.double)
lat = hdf.select('Latitude').get().astype(numpy.double)
[12]:
start = datetime.datetime.now()
sids = pystare.from_latlon_2d(lat=lat, lon=lon, adapt_level=True)
datetime.datetime.now()-start
[12]:
datetime.timedelta(microseconds=985640)
[13]:
print(pystare.spatial_resolution(sids).min())
print(pystare.spatial_resolution(sids).max())
9
11
Intersecting Data#
[14]:
world = geopandas.read_file(geopandas.datasets.get_path('naturalearth_lowres'))
world.sort_values(by='name', inplace=True)
world = starepandas.STAREDataFrame(world)
sids = world.make_sids(level=6)
world.set_sids(sids, inplace=True)
trixels = world.make_trixels()
world.set_trixels(trixels, inplace=True)
[15]:
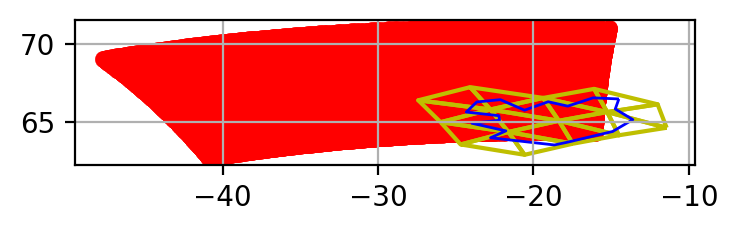
fig, ax = plt.subplots(figsize=(4,4), dpi=200)
ax.grid(True)

country = world[world.name=='Iceland']
country.plot(ax=ax, trixels=True, boundary=True, color='y', zorder=1)
country.plot(ax=ax, trixels=False, facecolor="none", edgecolor='blue', zorder=1)
modis.plot(ax=ax, color='red', trixels=False, zorder=0, linewidth=0.1)
[15]:
<AxesSubplot:>
[16]:
a = modis.stare_intersects(country['sids'].iloc[0])
a.any()
[16]:
True
[17]:
len(country['sids'].iloc[0])
[17]:
17
[ ]: