Note
This page was generated from examples/notebooks/individual_geoms.ipynb.
Working with individual Geometries#
[10]:
%matplotlib widget
import starepandas
import shapely
import matplotlib.pyplot as plt
[2]:
polygon = shapely.geometry.Polygon([[102.1, 33.1],
                                    [101.1, 35.1],
                                    [102.1, 35.1],
                                    [104.1, 33.1],
                                    [102.1, 33.1]])

indices = starepandas.sids_from_polygon(polygon, level=8, force_ccw=True)
indices
[2]:
array([694152476940566535, 694222845684744199, 595609846812770312,
       595636235091836936, 595645031184859144, 595653827277881352,
       595662623370903560, 595689011649970184, 595706603836014600,
       595724196022059016, 595732992115081224, 596067243649925128,
       596111224115036168, 596128816301080584, 694126088661499912,
       694134884754522120, 694143680847544328, 694187661312655368,
       694196457405677576, 694205253498699784, 694214049591721992,
       694328398801010696, 694574689405632520, 694583485498654728,
       694601077684699144, 694609873777721352, 694627465963765768,
       694636262056787976, 694645058149810184, 701453234148999176,
       701506010707132424, 701514806800154632, 701523602893176840,
       701532398986199048, 701541195079221256, 701549991172243464,
       701567583358287880, 701752301311754248, 701761097404776456,
       701778689590820872, 701787485683843080, 701796281776865288,
       701805077869887496, 701813873962909704, 701822670055931912,
       701866650521042952, 701893038800109576, 701901834893131784,
       701910630986153992, 701919427079176200, 701963407544287240,
       701980999730331656, 701989795823353864, 702033776288464904,
       702051368474509320, 702060164567531528])
[3]:
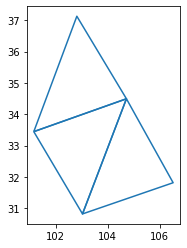
starepandas.to_trixels(indices, as_multipolygon=True)
[3]:

[4]:
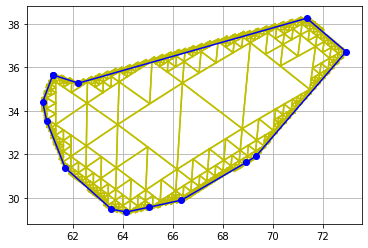
geom = shapely.wkt.loads('''POLYGON ((61.21081709172574 35.65007233330923,
                                      62.23065148300589 35.27066396742229,
                                      71.34813113799026 38.25890534113216,
                                      72.92002485544447 36.72000702569632,
                                      69.31776411324256 31.90141225842444,
                                      68.92667687365767 31.62018911389207,
                                      66.34647260932442 29.88794342703618,
                                      65.04686201361611 29.56003062592809,
                                      64.14800215033125 29.34081920014597,
                                      63.55026085801117 29.46833079682617,
                                      61.69931440618083 31.37950613049267,
                                      60.96370039250601 33.52883230237626,
                                      60.80319339380745 34.40410187431986,
                                      61.21081709172574 35.65007233330923))''')
indices = starepandas.sids_from_polygon(geom, level=10, force_ccw=True)
[5]:
fig, ax = plt.subplots()
ax.grid(True)

trixels = starepandas.to_trixels(indices, as_multipolygon=False)

for triangle in trixels:
    ax.plot(*triangle.exterior.xy, color='y')
ax.plot(*geom.exterior.xy, marker='o', color='b')
[5]:
[<matplotlib.lines.Line2D at 0x7f2c86f01090>]
[14]:
fig, ax = plt.subplots(dpi=200, figsize=(8, 5))
ax.grid(True)
fig.tight_layout()

pt = shapely.geometry.Point(66, 34.3)
pt_stare5 = starepandas.sids_from_shapely(pt, 5)
pt_stare6 = starepandas.sids_from_shapely(pt, 6)
pt_stare7 = starepandas.sids_from_shapely(pt, 7)
pt_trixel5 = starepandas.to_trixels(pt_stare5)
pt_trixel6 = starepandas.to_trixels(pt_stare6)
pt_trixel7 = starepandas.to_trixels(pt_stare7)


index_ranges = starepandas.sids_from_polygon(geom, level=7, force_ccw=True)
triangles = starepandas.to_trixels(index_ranges)
for triangle in triangles:
    ax.plot(*triangle.exterior.xy, color='y', zorder=0)
ax.plot(*geom.exterior.coords.xy, marker='o', zorder=1)


ax.plot(pt.x, pt.y, marker='*', color='r', zorder=1)
ax.plot(*pt_trixel6.exterior.coords.xy, color='m', zorder=2)
ax.plot(*pt_trixel7.exterior.coords.xy, color='r', zorder=3)

#ax.plot(*pt_trixel5.exterior.coords.xy, color='g', zorder=2)
intersection_trixel = starepandas.to_trixels([4063372763795030021])
ax.plot(*intersection_trixel.exterior.xy, color='green',
        linewidth=3)

print(hex(4063511879588628615), hex(4063372763795030021))
0x38647e866b75c887 0x3864000000000005
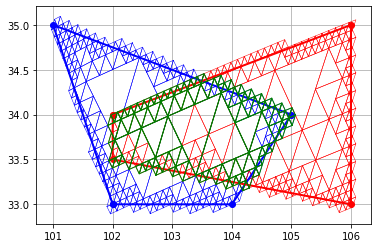
Intersection#
[7]:
import pystare
fig, ax = plt.subplots()
ax.grid(True)

polygon1 = shapely.geometry.Polygon([[102, 33], [101, 35], [105, 34], [104, 33], [102, 33]])
polygon2 = shapely.geometry.Polygon([[102, 34], [106, 35], [106, 33], [102, 33.5], [102, 34]])

range_indices1 = starepandas.sids_from_polygon(polygon1, level=10, force_ccw=True)
range_indices2 = starepandas.sids_from_polygon(polygon2, level=10, force_ccw=True)

triangles1 = starepandas.to_trixels(range_indices1)
triangles2 = starepandas.to_trixels(range_indices2)

for triangle in triangles1:
    ax.plot(*triangle.exterior.xy, color='blue', linewidth=0.5)

for triangle in triangles2:
    ax.plot(*triangle.exterior.xy, color='red', linewidth=0.5)

ax.plot(*polygon1.exterior.xy, marker='o', linewidth=2, color='blue')
ax.plot(*polygon2.exterior.xy, marker='o', linewidth=2, color='red')

intersect = pystare.intersect(range_indices1, range_indices2)
triangles3 = starepandas.to_trixels(intersect)


for triangle in triangles3:
    ax.plot(*triangle.exterior.xy, color='green', linewidth=1)
High Level#
[8]:
polygon1 = shapely.geometry.Polygon([[102, 33], [101, 35], [105, 34], [104, 33], [102, 33]])
polygon2 = shapely.geometry.Polygon([[102, 34], [106, 35], [106, 33], [102, 33.5], [102, 34]])

sids1 = starepandas.sids_from_polygon(polygon1, level=5, force_ccw=True)
sids2 = starepandas.sids_from_polygon(polygon2, level=5, force_ccw=True)
df = starepandas.STAREDataFrame(sids=[sids1])

intersection = df.stare_intersection(sids2)
df2 = starepandas.STAREDataFrame(sids=intersection)
df2.add_trixels().plot(trixels=True)
[8]:
<AxesSubplot:>