Note
This page was generated from examples/notebooks/sid_resolution.ipynb.
SID resolution manipulations#
[1]:
import starepandas
import pystare
import geopandas
import matplotlib.pyplot as plt
[2]:
sids = [2299437706637111721, 2299435211084507593, 2299566194809236969]
sdf = starepandas.STAREDataFrame(sids=sids)
Change resolutions#
[3]:
sdf.to_stare_level(level=6, clear_to_level=False)
[3]:
| sids | |
|---|---|
| 0 | 2299437706637111718 |
| 1 | 2299435211084507590 |
| 2 | 2299566194809236966 |
Clear Resolution#
[4]:
sdf.clear_to_level(inplace=False)
[4]:
| sids | |
|---|---|
| 0 | 2299437254470270985 |
| 1 | 2299435055447015433 |
| 2 | 2299564797819093001 |
To single resolution#
[5]:
world = geopandas.read_file(geopandas.datasets.get_path('naturalearth_lowres'))
europe  = world[world.continent=='Europe']
europe = starepandas.STAREDataFrame(europe, add_sids=True, level=7, add_trixels=True)
[6]:
europe2 = europe.to_stare_singlelevel()
trixels = europe2.make_trixels()
europe2.set_trixels(trixels, inplace=True)
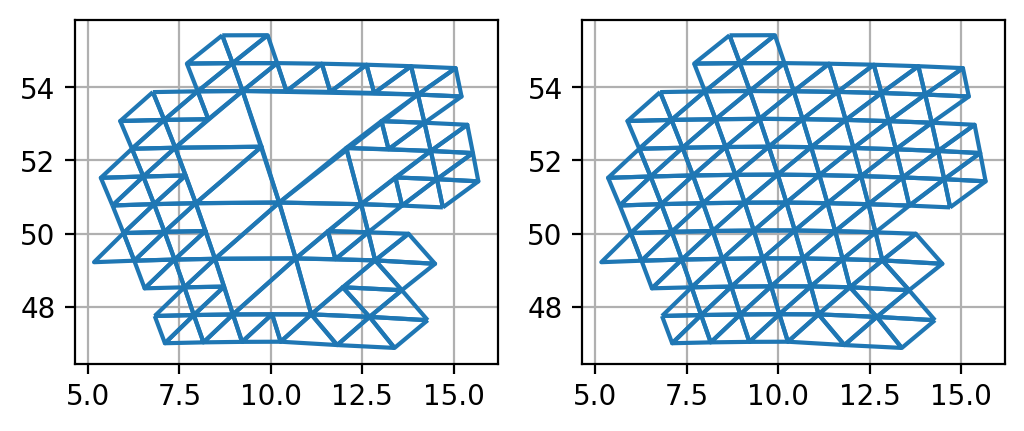
[7]:
fig, ax = plt.subplots(1, 2, dpi=200, figsize=(6,6))
ax[0].grid(True)
ax[1].grid(True)

europe[europe.name=='Germany'].plot(ax=ax[0], trixels=True)
europe2[europe2.name=='Germany'].plot(ax=ax[1], trixels=True)

ax[0].set_aspect('equal')
ax[1].set_aspect('equal')
[8]:
len(europe2.sids.iloc[0])
[8]:
4533
[ ]: