Note
This page was generated from examples/notebooks/read_granules.ipynb.
Read Granules#
[1]:
import starepandas
import matplotlib.pyplot as plt
import numpy
import pandas
import geopandas
import pystare
import gc
Manually reading#
[2]:
vnp03_name = '../tests/data/granules/viirs/VNP03DNB.A2022308.1930.002.2022309041547.nc'
vnp03 = starepandas.io.granules.VNP03DNB(vnp03_name)
vnp03.read_latlon()
vnp03.read_data()
vnp03 = vnp03.to_df(xy=True)
VNP03#
[3]:
file_path = '../tests/data/granules/viirs/VNP09.A2022308.1930.001.2022309070407.hdf'
vnp09 = starepandas.io.granules.viirsl2.VNP09(file_path, nom_res='750m')
vnp09.read_data()
vnp09.read_timestamps()
[4]:
vnp03_path = vnp09.guess_companion_path(prefix='VNP03MOD')
vnp03 = starepandas.io.granules.VNP03MOD(vnp03_path)
vnp03.read_data()
vnp03.read_sidecar_index()
vnp03.read_sidecar_latlon()
[5]:
vnp09 = vnp09.to_df(xy=True)
vnp03 = vnp03.to_df()
vnp09 = vnp09.join(vnp03)
vnp09.dropna(inplace=True)
[6]:
#qf1 = starepandas.io.granules.viirsl2.decode_qf1(vnp09['QF1 Surface Reflectance'])
#qf2 = starepandas.io.granules.viirsl2.decode_qf2(vnp09['QF2 Surface Reflectance'])
#vnp09 = vnp09.join(qf1).join(qf2)
[8]:
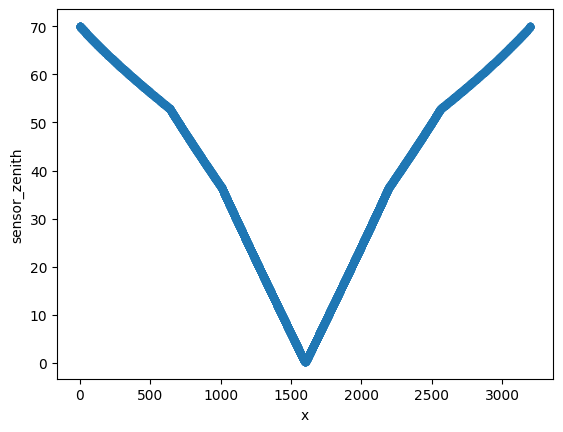
pandas.DataFrame(vnp09[0:10000]).plot(x='x', y='sensor_zenith', kind='scatter')
[8]:
<Axes: xlabel='x', ylabel='sensor_zenith'>
[9]:
vnp09.info(memory_usage='deep')
<class 'starepandas.staredataframe.STAREDataFrame'>
Index: 8993654 entries, 1008 to 10341391
Data columns (total 24 columns):
 #   Column                             Dtype
---  ------                             -----
 0   ts_start                           datetime64[ns]
 1   ts_end                             datetime64[ns]
 2   x                                  uint16
 3   y                                  uint16
 4   750m Surface Reflectance Band M1   float64
 5   750m Surface Reflectance Band M2   float64
 6   750m Surface Reflectance Band M3   float64
 7   750m Surface Reflectance Band M4   float64
 8   750m Surface Reflectance Band M5   float64
 9   750m Surface Reflectance Band M7   float64
 10  750m Surface Reflectance Band M8   float64
 11  750m Surface Reflectance Band M10  float64
 12  750m Surface Reflectance Band M11  float64
 13  QF1 Surface Reflectance            UInt8
 14  QF2 Surface Reflectance            UInt8
 15  lat                                float32
 16  lon                                float32
 17  sids                               Int64
 18  land_water_mask                    UInt8
 19  quality_flag                       UInt8
 20  sensor_azimuth                     float32
 21  sensor_zenith                      float32
 22  solar_azimuth                      float32
 23  solar_zenith                       float32
dtypes: Int64(1), UInt8(4), datetime64[ns](2), float32(6), float64(9), uint16(2)
memory usage: 1.2 GB
[10]:
del vnp03, vnp09
gc.collect()
[10]:
117
MOD09GA#
[11]:
file_name = '../tests/data/granules/MOD09GA.A2020009.h00v08.006.2020011025435.hdf'
[12]:
mod09ga = starepandas.read_granule(file_name, xy=True)
mod09ga
[12]:
| x | y | sur_refl_b01_1 | sur_refl_b02_1 | sur_refl_b03_1 | sur_refl_b04_1 | sur_refl_b05_1 | sur_refl_b06_1 | sur_refl_b07_1 | QC_500m_1 | obscov_500m_1 | |
|---|---|---|---|---|---|---|---|---|---|---|---|
| 0 | 0 | 0 | NaN | NaN | NaN | NaN | NaN | NaN | NaN | <NA> | NaN |
| 1 | 1 | 0 | NaN | NaN | NaN | NaN | NaN | NaN | NaN | <NA> | NaN |
| 2 | 2 | 0 | NaN | NaN | NaN | NaN | NaN | NaN | NaN | <NA> | NaN |
| 3 | 3 | 0 | NaN | NaN | NaN | NaN | NaN | NaN | NaN | <NA> | NaN |
| 4 | 4 | 0 | NaN | NaN | NaN | NaN | NaN | NaN | NaN | <NA> | NaN |
| ... | ... | ... | ... | ... | ... | ... | ... | ... | ... | ... | ... |
| 5759995 | 2395 | 2399 | 0.2020 | 0.1939 | 0.2187 | 0.2053 | 0.1872 | 0.1359 | 0.0817 | 1073741824 | 0.15 |
| 5759996 | 2396 | 2399 | 0.2122 | 0.2043 | 0.2320 | 0.2174 | 0.2015 | 0.1356 | 0.0900 | 1073741824 | 0.19 |
| 5759997 | 2397 | 2399 | 0.2122 | 0.2043 | 0.2320 | 0.2174 | 0.2015 | 0.1356 | 0.0900 | 1073741824 | 0.19 |
| 5759998 | 2398 | 2399 | 0.2174 | 0.2094 | 0.2342 | 0.2225 | 0.2074 | 0.1464 | 0.0867 | 1073741824 | 0.11 |
| 5759999 | 2399 | 2399 | 0.2174 | 0.2094 | 0.2342 | 0.2225 | 0.2074 | 0.1464 | 0.0867 | 1073741824 | 0.14 |
5760000 rows × 11 columns
[13]:
mod09ga = starepandas.io.granules.Mod09GA(file_name)
mod09ga.read_data()

ds_name = 'state_1km_1'
mod09ga.read_dataset(ds_name, resample_factor=2)
mod09ga.decode_state('state_1km_1')
mod09ga.to_df()
[13]:
| sur_refl_b01_1 | sur_refl_b02_1 | sur_refl_b03_1 | sur_refl_b04_1 | sur_refl_b05_1 | sur_refl_b06_1 | sur_refl_b07_1 | QC_500m_1 | obscov_500m_1 | state_1km_1 | cloud | cloud_shadow | cloud_internal | snow_mod35 | snow_internal | |
|---|---|---|---|---|---|---|---|---|---|---|---|---|---|---|---|
| 0 | NaN | NaN | NaN | NaN | NaN | NaN | NaN | <NA> | NaN | <NA> | <NA> | True | True | True | True |
| 1 | NaN | NaN | NaN | NaN | NaN | NaN | NaN | <NA> | NaN | <NA> | <NA> | True | True | True | True |
| 2 | NaN | NaN | NaN | NaN | NaN | NaN | NaN | <NA> | NaN | <NA> | <NA> | True | True | True | True |
| 3 | NaN | NaN | NaN | NaN | NaN | NaN | NaN | <NA> | NaN | <NA> | <NA> | True | True | True | True |
| 4 | NaN | NaN | NaN | NaN | NaN | NaN | NaN | <NA> | NaN | <NA> | <NA> | True | True | True | True |
| ... | ... | ... | ... | ... | ... | ... | ... | ... | ... | ... | ... | ... | ... | ... | ... |
| 5759995 | 0.2020 | 0.1939 | 0.2187 | 0.2053 | 0.1872 | 0.1359 | 0.0817 | 1073741824 | 0.15 | 1849 | 1 | False | True | False | False |
| 5759996 | 0.2122 | 0.2043 | 0.2320 | 0.2174 | 0.2015 | 0.1356 | 0.0900 | 1073741824 | 0.19 | 1849 | 1 | False | True | False | False |
| 5759997 | 0.2122 | 0.2043 | 0.2320 | 0.2174 | 0.2015 | 0.1356 | 0.0900 | 1073741824 | 0.19 | 1849 | 1 | False | True | False | False |
| 5759998 | 0.2174 | 0.2094 | 0.2342 | 0.2225 | 0.2074 | 0.1464 | 0.0867 | 1073741824 | 0.11 | 1849 | 1 | False | True | False | False |
| 5759999 | 0.2174 | 0.2094 | 0.2342 | 0.2225 | 0.2074 | 0.1464 | 0.0867 | 1073741824 | 0.14 | 1849 | 1 | False | True | False | False |
5760000 rows × 15 columns
[14]:
del mod09ga
gc.collect()
[14]:
0
MOD09#
[15]:
file_name = '../tests/data/granules/MOD09.A2002299.0710.006.2015151173939.hdf'
mod09 = starepandas.read_granule(file_name)
[16]:
starepandas.io.granules.modis.decode_state(mod09['1km Reflectance Data State QA'])
[16]:
| cloud | cloud_shadow | cloud_internal | snow_mod35 | snow_internal | |
|---|---|---|---|---|---|
| 0 | 00 | False | False | False | False |
| 1 | 00 | False | False | False | False |
| 2 | 00 | False | False | False | False |
| 3 | 00 | False | False | False | False |
| 4 | 00 | False | False | False | False |
| ... | ... | ... | ... | ... | ... |
| 2748615 | 00 | False | False | False | False |
| 2748616 | 00 | False | False | False | False |
| 2748617 | 00 | False | False | False | False |
| 2748618 | 00 | False | False | False | False |
| 2748619 | 00 | False | False | False | False |
2748620 rows × 5 columns
[17]:
del mod09
gc.collect()
[17]:
19
MOD05#
[18]:
fname = '../tests/data/granules/MOD05_L2.A2019336.0000.061.2019336211522.hdf'
mod05 = starepandas.read_granule(fname, sidecar=True, latlon=True, xy=True, read_timestamp=True)
sids = mod05.to_array(mod05._sid_column_name)
#mod05.to_sidecar('test.nc')
[19]:
mod05
[19]:
| lat | lon | sids | ts_start | ts_end | x | y | Scan_Start_Time | Solar_Zenith | Solar_Azimuth | Sensor_Zenith | Sensor_Azimuth | Water_Vapor_Infrared | |
|---|---|---|---|---|---|---|---|---|---|---|---|---|---|
| 0 | 53.201778 | -15.933996 | 4298473764500464809 | 2019-12-02 | 2019-12-02 00:05:00 | 0 | 0 | 8.493984e+08 | 147.089997 | -22.959999 | 65.339999 | -89.519998 | NaN |
| 1 | 53.203171 | -16.288101 | 4298458168380511209 | 2019-12-02 | 2019-12-02 00:05:00 | 1 | 0 | 8.493984e+08 | 146.999997 | -23.539999 | 64.719999 | -89.799998 | NaN |
| 2 | 53.203518 | -16.629105 | 4297394569014717897 | 2019-12-02 | 2019-12-02 00:05:00 | 2 | 0 | 8.493984e+08 | 146.919997 | -24.099999 | 64.109999 | -90.079998 | NaN |
| 3 | 53.202934 | -16.957928 | 4297300698872999369 | 2019-12-02 | 2019-12-02 00:05:00 | 3 | 0 | 8.493984e+08 | 146.839997 | -24.639999 | 63.509999 | -90.339998 | NaN |
| 4 | 53.201508 | -17.275316 | 4297290857922121161 | 2019-12-02 | 2019-12-02 00:05:00 | 4 | 0 | 8.493984e+08 | 146.759997 | -25.159999 | 62.909999 | -90.589998 | NaN |
| ... | ... | ... | ... | ... | ... | ... | ... | ... | ... | ... | ... | ... | ... |
| 109615 | 64.084297 | -66.281410 | 3727686638370615689 | 2019-12-02 | 2019-12-02 00:05:00 | 265 | 405 | 8.493987e+08 | 121.569997 | -74.679998 | 62.229999 | 47.999999 | NaN |
| 109616 | 63.960953 | -66.591354 | 3727661374545790857 | 2019-12-02 | 2019-12-02 00:05:00 | 266 | 405 | 8.493987e+08 | 121.469997 | -75.049998 | 62.819999 | 47.719999 | NaN |
| 109617 | 63.831799 | -66.911255 | 3727838256925064969 | 2019-12-02 | 2019-12-02 00:05:00 | 267 | 405 | 8.493987e+08 | 121.369997 | -75.439998 | 63.419999 | 47.429999 | NaN |
| 109618 | 63.698635 | -67.236229 | 3727843063731949801 | 2019-12-02 | 2019-12-02 00:05:00 | 268 | 405 | 8.493987e+08 | 121.259997 | -75.829998 | 64.019999 | 47.139999 | NaN |
| 109619 | 63.551617 | -67.589508 | 3727853163225616425 | 2019-12-02 | 2019-12-02 00:05:00 | 269 | 405 | 8.493987e+08 | 121.149997 | -76.249998 | 64.639999 | 46.819999 | NaN |
109620 rows × 13 columns
Subset Loading#
[20]:
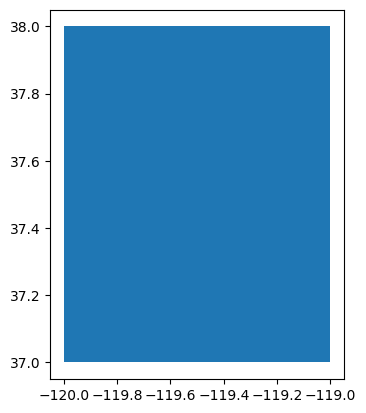
import shapely
roi = shapely.geometry.Polygon([[-120, 37],[-120, 38],[-119, 38],[-119, 37]])
roi = geopandas.GeoDataFrame(geometry=[roi], crs=4326)
roi = starepandas.STAREDataFrame(roi)
roi['sids'] = roi.make_sids(level=10)
sids = roi.sids.iloc[0]
[21]:
roi.plot(trixels=False)
[21]:
<Axes: >
[22]:
fname = '../tests/data/granules/MOD05_L2.A2019336.0000.061.2019336211522.hdf'
mod = starepandas.io.granules.Mod05(fname)
mod.read_sidecar_index()
[23]:
intersects = pystare.intersects(sids, mod.sids.flatten())
intersects = numpy.reshape(intersects, mod.sids.shape)
intersects
[23]:
array([[False, False, False, ..., False, False, False],
       [False, False, False, ..., False, False, False],
       [False, False, False, ..., False, False, False],
       ...,
       [False, False, False, ..., False, False, False],
       [False, False, False, ..., False, False, False],
       [False, False, False, ..., False, False, False]])
VNP02#
[24]:
vnp02_name = '../tests/data/granules/viirs/VNP02DNB.A2022308.1930.002.2022309051542.nc'
vnp02 = starepandas.read_granule(vnp02_name, sidecar=False, latlon=False)

vnp03_name = '../tests/data/granules/viirs/VNP03DNB.A2022308.1930.002.2022309041547.nc'
vnp03 = starepandas.read_granule(vnp03_name, sidecar=True, latlon=False)
[25]:
vnp02 = vnp03.join(vnp02)
[26]:
vnp02[(vnp02.land_water_mask==2) | (vnp02.land_water_mask==4) | (vnp02.land_water_mask==6) | (vnp02.land_water_mask==7)]
[26]:
| sids | moon_illumination_fraction | land_water_mask | quality_flag | DNB_observations | DNB_quality_flags | |
|---|---|---|---|---|---|---|
| 72 | 3141596848628017166 | 85.949997 | 2 | 0 | 0.002691 | 0 |
| 73 | 3141596267891641230 | 85.949997 | 2 | 0 | 0.002290 | 0 |
| 78 | 3141596311239885294 | 85.949997 | 2 | 0 | 0.004192 | 0 |
| 682 | 3136255941480419886 | 85.939995 | 2 | 0 | 0.001281 | 0 |
| 683 | 3136257757938132206 | 85.939995 | 2 | 0 | 0.001304 | 0 |
| ... | ... | ... | ... | ... | ... | ... |
| 13134834 | 3251432349700346061 | 85.709999 | 2 | 0 | 0.004365 | 0 |
| 13134836 | 3251432266683722606 | 85.709999 | 2 | 0 | 0.004577 | 0 |
| 13134839 | 3251396673547934318 | 85.709999 | 2 | 0 | 0.004433 | 0 |
| 13134845 | 3249540731532554573 | 85.709999 | 2 | 0 | 0.004744 | 0 |
| 13134846 | 3249541108125026062 | 85.709999 | 2 | 0 | 0.004699 | 0 |
541944 rows × 6 columns
[27]:
del vnp02, vnp03
gc.collect()
[27]:
105
VNP CLDMSK#
[28]:
cldmsk_name = '../tests/data/granules/CLDMSK_L2_VIIRS_SNPP.A2020219.0742.001.2020219190616.nc'
cldmsk = starepandas.io.granules.CLDMSKL2VIIRS(cldmsk_name)
[29]:
cldmsk.read_latlon()
cldmsk.read_data()
cldmsk.to_df()
[29]:
| lat | lon | Integer_Cloud_Mask | |
|---|---|---|---|
| 0 | 41.747662 | -104.969498 | 3 |
| 1 | 41.747696 | -104.950218 | 3 |
| 2 | 41.747730 | -104.930237 | 3 |
| 3 | 41.747761 | -104.910843 | 3 |
| 4 | 41.747784 | -104.891747 | 3 |
| ... | ... | ... | ... |
| 10342395 | 16.522247 | -78.595093 | 2 |
| 10342396 | 16.518646 | -78.580162 | 1 |
| 10342397 | 16.515034 | -78.565208 | 0 |
| 10342398 | 16.511414 | -78.550224 | 1 |
| 10342399 | 16.507788 | -78.535187 | 1 |
10342400 rows × 3 columns
[30]:
del cldmsk
gc.collect()
[30]:
25
Plotting#
[31]:
path = '../tests/data/granules/viirs/VNP03DNB.A2022308.1930.002.2022309041547.nc'
vnp03dnb = starepandas.io.granules.VNP03DNB(path)
vnp03dnb.read_latlon()

path = '../tests/data/granules/viirs/VNP03MOD.A2022308.1930.002.2022309041547.nc'
vnp03mod = starepandas.io.granules.VNP03MOD(path)
vnp03mod.read_latlon()

path = '../tests/data/granules/CLDMSK_L2_VIIRS_SNPP.A2020219.0742.001.2020219190616.nc'
cldmsk = starepandas.io.granules.CLDMSKL2VIIRS(path)
cldmsk.read_latlon()
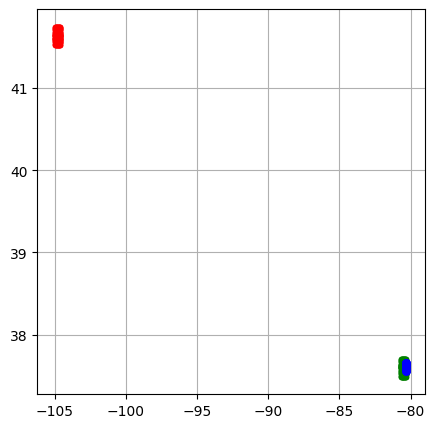
[32]:
fig, ax = plt.subplots(figsize=(5,5), dpi=100)

n = 20
ns = 0
nt = 0

ax.grid('on')

ax.plot(cldmsk.lon[ns:ns+n, nt:nt+n].flatten(), cldmsk.lat[ns:ns+n, nt:nt+n].flatten(),
        color='r', lw=0, marker='.')

ax.plot(vnp03mod.lon[ns:ns+n, nt:nt+n].flatten(), vnp03mod.lat[ns:ns+n, nt:nt+n].flatten(),
        color='g',lw=0, marker='.')

ax.plot(vnp03dnb.lon[ns:ns+n, nt:nt+n].flatten(), vnp03dnb.lat[ns:ns+n, nt:nt+n].flatten(),
        color='b',lw=0, marker='.')
[32]:
[<matplotlib.lines.Line2D at 0x7f8a7f393a00>]
[ ]: