Note
This page was generated from examples/notebooks/spatial_relations.ipynb.
Spatial Relation tests#
[1]:
import starepandas
import geopandas
import matplotlib.pyplot as plt
Cities#
[2]:
cities = ['Buenos Aires', 'Brasilia', 'Santiago',
          'Bogota', 'Caracas', 'Sao Paulo', 'Bridgetown']

latitudes = [-34.58, -15.78, -33.45, 4.60, 10.48, -23.55, 13.1]
longitudes = [-58.66, -47.91, -70.66, -74.08, -66.86, -46.63, -59.62]

data =  {'City': cities,
         'Latitude': latitudes,
         'Longitude': longitudes}

cities = starepandas.STAREDataFrame(data)
stare = starepandas.sids_from_xy(cities.Longitude, cities.Latitude, level=27)
geom = geopandas.points_from_xy(cities.Longitude, cities.Latitude, crs='EPSG:4326')
cities.set_sids(stare, inplace=True)
cities.set_geometry(geom, inplace=True)
cities.add_trixels(inplace=True)
Countries#
[3]:
countries = geopandas.read_file(geopandas.datasets.get_path('naturalearth_lowres'))
countries = countries.sort_values(by='name')
samerica = countries[countries.continent=='South America']

sids = starepandas.sids_from_gdf(samerica, level=7, force_ccw=True)
samerica = starepandas.STAREDataFrame(samerica, sids=sids)
trixels = samerica.make_trixels()
samerica.set_trixels(trixels, inplace=True)
[4]:
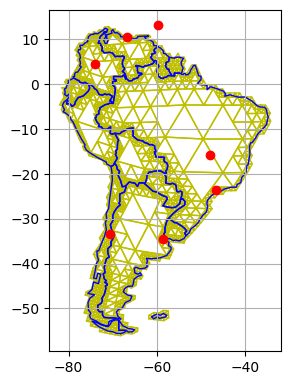
fig, ax = plt.subplots(figsize=(3,7), dpi=100)
ax.grid(True)

samerica.plot(ax=ax, trixels=True, color='y', lw=1, zorder=0)
samerica.plot(ax=ax, trixels=False, facecolor='none', edgecolor='blue', lw=1, zorder=1)
cities.plot(ax=ax, trixels=False, color='r', zorder=2)
[4]:
<AxesSubplot:>
[5]:
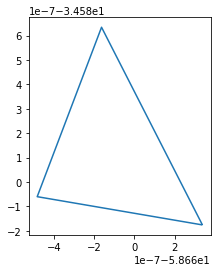
# The cities trixels are too small to be visible,
# but they do exist:
cities[0:1].plot(trixels=True)
[5]:
<AxesSubplot:>
Intersects Points#
[6]:
brasilia = cities[cities.City=='Brasilia']
[7]:
# We do intersect of single feauture and collection;
# Intersects of two collections only is defined row-wise

# Conventional intersect
intersects_conv = samerica.intersects(brasilia.iloc[0].geometry)

# Stare intersect
intersects_stare = samerica.stare_intersects(brasilia.iloc[0].sids)
[8]:
sids = samerica[samerica['name']=='Brazil'].make_sids(level=5)
sids
[8]:
29    [2749447572509687812, 2796735368597078020, 286...
Name: sids, dtype: object
[9]:
cities
[9]:
| City | Latitude | Longitude | sids | geometry | trixels | |
|---|---|---|---|---|---|---|
| 0 | Buenos Aires | -34.58 | -58.66 | 2663379193440875387 | POINT (-58.66000 -34.58000) | POLYGON ((-58.66000 -34.58000, -58.66000 -34.5... |
| 1 | Brasilia | -15.78 | -47.91 | 2867415364672350651 | POINT (-47.91000 -15.78000) | POLYGON ((-47.91000 -15.78000, -47.91000 -15.7... |
| 2 | Santiago | -33.45 | -70.66 | 2723774768829278555 | POINT (-70.66000 -33.45000) | POLYGON ((-70.66000 -33.45000, -70.66000 -33.4... |
| 3 | Bogota | 4.60 | -74.08 | 2667981979956219515 | POINT (-74.08000 4.60000) | POLYGON ((-74.08000 4.60000, -74.08000 4.60000... |
| 4 | Caracas | 10.48 | -66.86 | 2494081632617553403 | POINT (-66.86000 10.48000) | POLYGON ((-66.86000 10.48000, -66.86000 10.480... |
| 5 | Sao Paulo | -23.55 | -46.63 | 2803225788975740475 | POINT (-46.63000 -23.55000) | POLYGON ((-46.63000 -23.55000, -46.63000 -23.5... |
| 6 | Bridgetown | 13.10 | -59.62 | 2518254660685127707 | POINT (-59.62000 13.10000) | POLYGON ((-59.62000 13.10000, -59.62000 13.100... |
[10]:
sum(~cities.stare_intersects(sids.iloc[0]))
[10]:
5
Intersects Polygons#
[11]:
# Sao Paulo Sate
fname = 'zip://../tests/data/sp_state.zip'
sao_paulo = geopandas.read_file(fname) # Nice flex
sao_paulo = sao_paulo[sao_paulo.mslink==221]
sids = starepandas.sids_from_gdf(sao_paulo, level=10, force_ccw=True)
sao_paulo = starepandas.STAREDataFrame(sao_paulo, sids=sids)
[12]:
sum(~samerica.stare_intersects(sao_paulo['sids'].iloc[0]))
[12]:
12
[ ]: